From Bike Collectives Wiki
Basic Organization Information
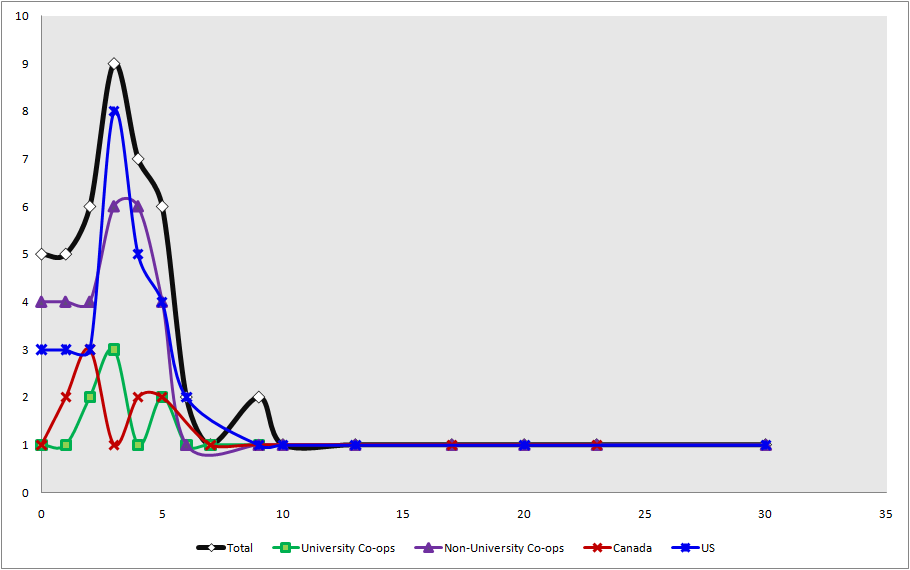
Year of Establishment
| Answer
|
Total
|
University Co-ops
|
Non-University Co-ops
|
Canada
|
US
|
| 1980
|
1
|
0
|
1
|
0
|
1
|
| 1987
|
1
|
0
|
1
|
1
|
0
|
| 1990
|
1
|
0
|
1
|
0
|
1
|
| 1991
|
0
|
0
|
0
|
0
|
0
|
| 1992
|
0
|
0
|
0
|
0
|
0
|
| 1993
|
1
|
0
|
1
|
1
|
0
|
| 1994
|
0
|
0
|
0
|
0
|
0
|
| 1995
|
0
|
0
|
0
|
0
|
0
|
| 1996
|
0
|
0
|
0
|
0
|
0
|
| 1997
|
1
|
0
|
1
|
0
|
1
|
| 1998
|
0
|
0
|
0
|
0
|
0
|
| 1999
|
0
|
0
|
0
|
0
|
0
|
| 2000
|
1
|
0
|
1
|
0
|
1
|
| 2001
|
2
|
1
|
1
|
1
|
1
|
| 2002
|
0
|
0
|
0
|
0
|
0
|
| 2003
|
1
|
1
|
0
|
1
|
0
|
| 2004
|
2
|
1
|
1
|
0
|
2
|
| 2005
|
6
|
2
|
4
|
2
|
4
|
| 2006
|
7
|
1
|
6
|
2
|
5
|
| 2007
|
9
|
3
|
6
|
1
|
8
|
| 2008
|
6
|
2
|
4
|
3
|
3
|
| 2009
|
5
|
1
|
4
|
2
|
3
|
| 2010
|
5
|
1
|
4
|
1
|
3
|
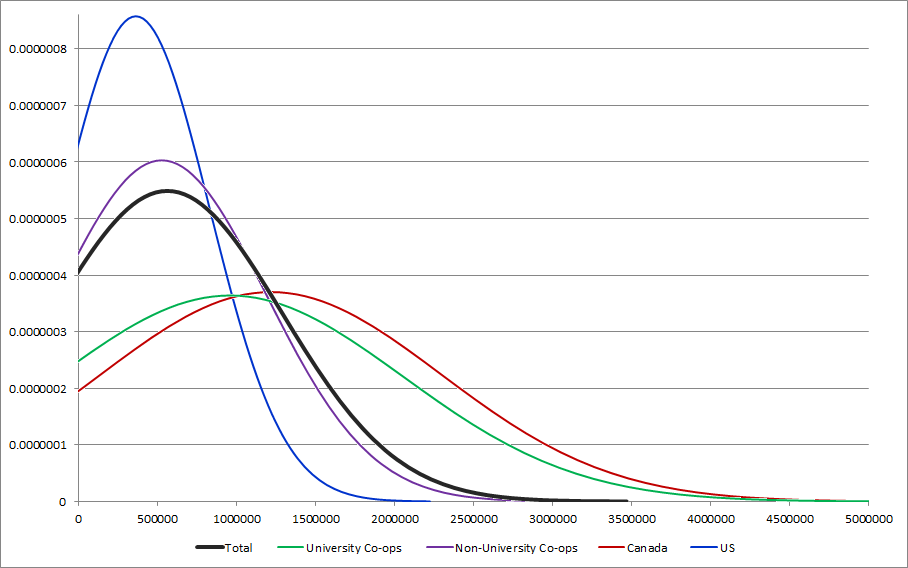
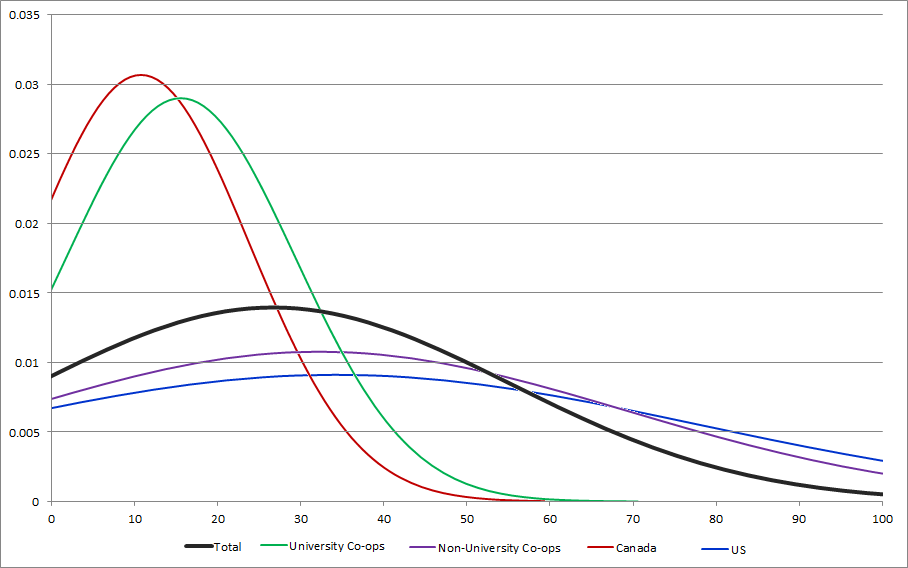
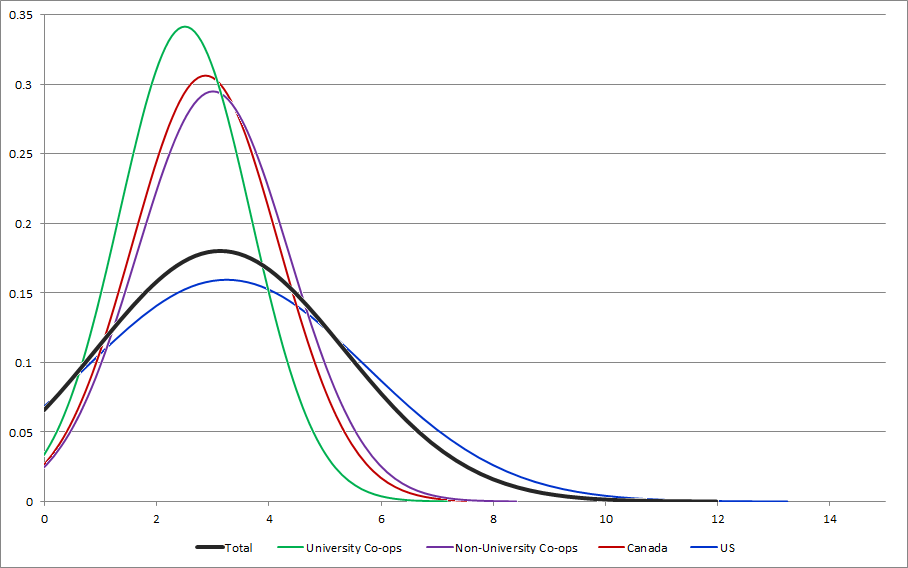
Visualization of distribution of ages of respondent organizations
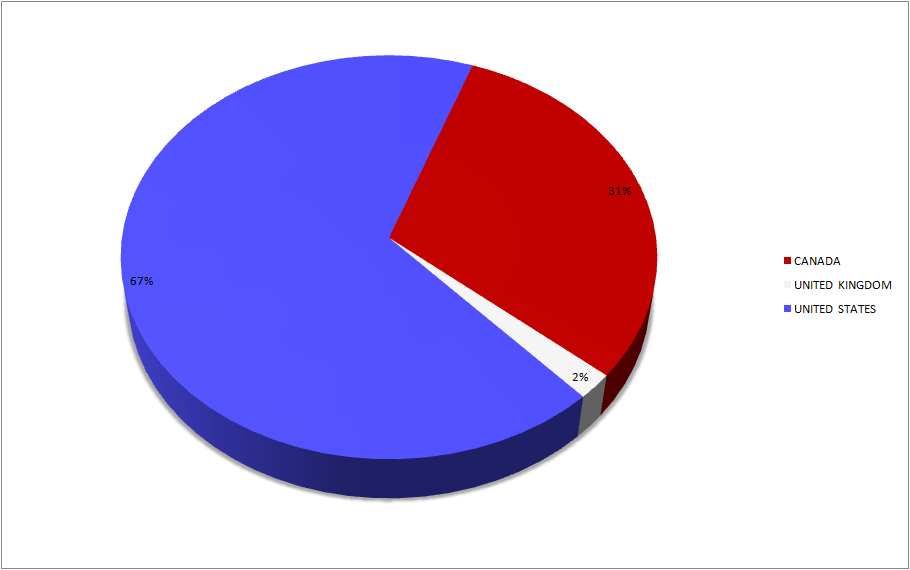
LOCATION
Country
| Answer
|
Total
|
University Co-ops
|
Non-University Co-ops
|
Canada
|
US
|
| CANADA
|
15
|
7
|
8
|
15
|
0
|
| UNITED KINGDOM
|
1
|
0
|
1
|
0
|
0
|
| UNITED STATES
|
33
|
6
|
27
|
0
|
33
|
}
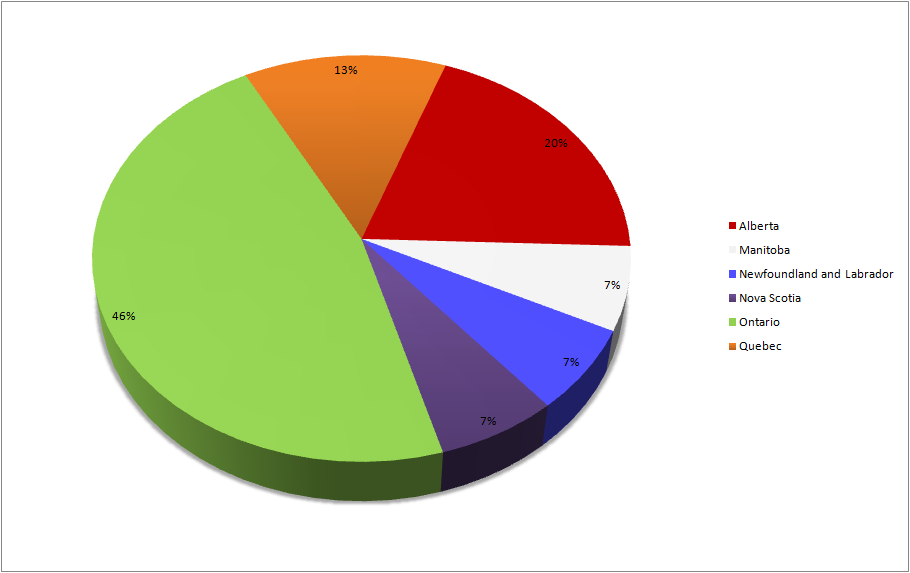
Province
| Answer
|
Total
|
University Co-ops
|
Non-University Co-ops
|
Canada
|
US
|
| Alberta
|
3
|
1
|
2
|
3
|
0
|
| Manitoba
|
1
|
0
|
1
|
1
|
0
|
| Newfoundland and Labrador
|
1
|
0
|
1
|
1
|
0
|
| Nova Scotia
|
1
|
1
|
0
|
1
|
0
|
| Ontario
|
7
|
3
|
4
|
7
|
0
|
| Quebec
|
2
|
2
|
0
|
2
|
0
|
}
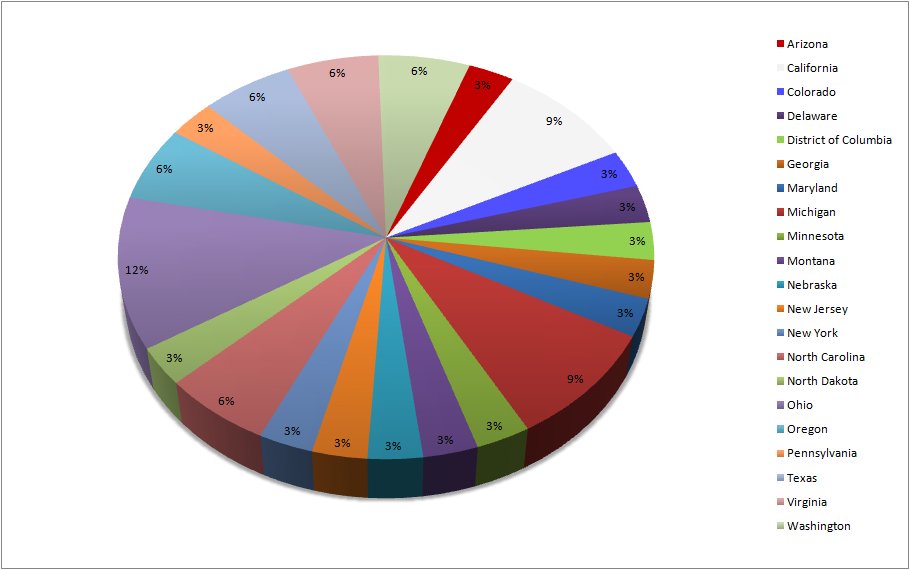
State
| Answer
|
Total
|
University Co-ops
|
Non-University Co-ops
|
Canada
|
US
|
| Arizona
|
1
|
1
|
0
|
0
|
1
|
| California
|
3
|
1
|
2
|
0
|
3
|
| Colorado
|
1
|
1
|
0
|
0
|
1
|
| Delaware
|
1
|
0
|
1
|
0
|
1
|
| District of Columbia
|
1
|
0
|
1
|
0
|
1
|
| Georgia
|
1
|
0
|
1
|
0
|
1
|
| Maryland
|
1
|
0
|
1
|
0
|
1
|
| Michigan
|
3
|
1
|
2
|
0
|
3
|
| Minnesota
|
1
|
0
|
1
|
0
|
1
|
| Montana
|
1
|
0
|
1
|
0
|
1
|
| Nebraska
|
1
|
0
|
1
|
0
|
1
|
| New Jersey
|
1
|
0
|
1
|
0
|
1
|
| New York
|
1
|
0
|
1
|
0
|
1
|
| North Carolina
|
2
|
0
|
2
|
0
|
2
|
| North Dakota
|
1
|
0
|
1
|
0
|
1
|
| Ohio
|
4
|
0
|
4
|
0
|
4
|
| Oregon
|
2
|
0
|
2
|
0
|
2
|
| Pennsylvania
|
1
|
0
|
1
|
0
|
1
|
| Texas
|
2
|
2
|
0
|
0
|
2
|
| Virginia
|
2
|
0
|
2
|
0
|
2
|
| Washington
|
2
|
0
|
2
|
0
|
2
|
}
City / Town / Municipality
| Answer
|
49
|
13
|
36
|
15
|
33
|
}
File:CENSUS2010 LOCATION CITY.png
Population
| Answer
|
Total
|
University Co-ops
|
Non-University Co-ops
|
Canada
|
US
|
| 5 000 - 10 000
|
2
|
0
|
2
|
0
|
2
|
| 10 000 - 50 000
|
4
|
2
|
2
|
0
|
4
|
| 50 000 - 100 000
|
7
|
2
|
5
|
1
|
6
|
| 100 000 - 500 000
|
16
|
3
|
13
|
4
|
12
|
| 500 000 - 1 000 000
|
11
|
2
|
9
|
3
|
7
|
| 1 000 000 - 5 000 000
|
7
|
4
|
3
|
6
|
1
|
| 5 000 000 - 10 000 000
|
2
|
0
|
2
|
1
|
1
|
}
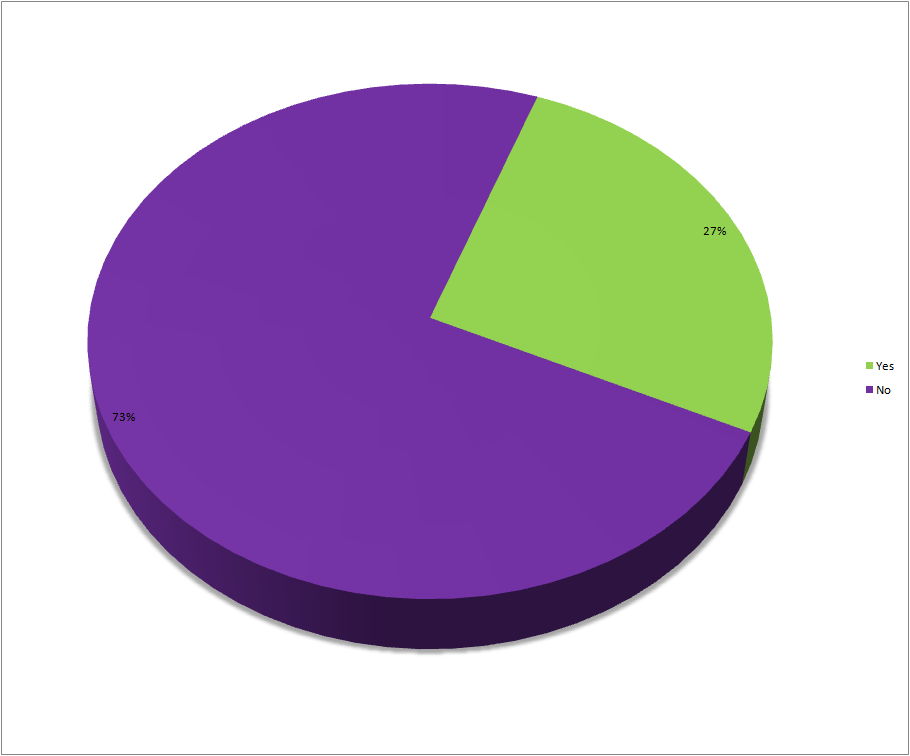
Is your collective / organization associated in any way with a university or college?
| Answer
|
Total
|
University Co-ops
|
Non-University Co-ops
|
Canada
|
US
|
| Yes
|
13
|
13
|
0
|
7
|
6
|
| No
|
36
|
0
|
36
|
8
|
27
|
}
SERVICES
DIY repair services
| Answer
|
Total
|
University Co-ops
|
Non-University Co-ops
|
Canada
|
US
|
| YES
|
48
|
13
|
35
|
15
|
32
|
}
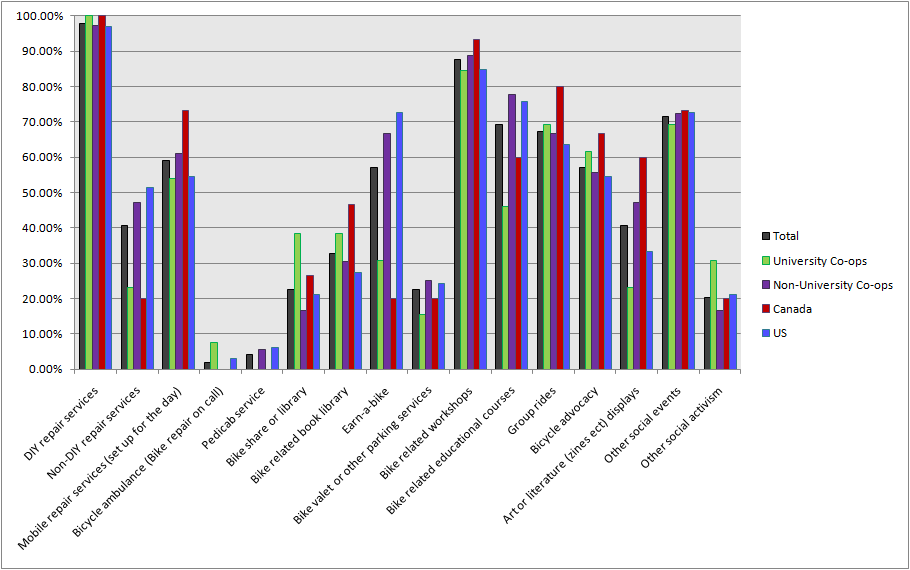
Non-DIY repair services
| Answer
|
Total
|
University Co-ops
|
Non-University Co-ops
|
Canada
|
US
|
| YES
|
20
|
3
|
17
|
3
|
17
|
}
[[File:CENSUS2010_SERVICES_SERVICES What services did your organization or collective offer in 2010?.png]]
Mobile repair services
| Answer
|
Total
|
University Co-ops
|
Non-University Co-ops
|
Canada
|
US
|
| YES
|
29
|
7
|
22
|
11
|
18
|
| Used to
|
2
|
0
|
2
|
1
|
1
|
| Want / Trying / Going to
|
6
|
2
|
4
|
1
|
5
|
}
Bicycle ambulance
| Answer
|
Total
|
University Co-ops
|
Non-University Co-ops
|
Canada
|
US
|
| YES
|
1
|
1
|
0
|
0
|
1
|
| Used to
|
1
|
0
|
1
|
0
|
1
|
| Want / Trying / Going to
|
1
|
1
|
0
|
1
|
0
|
}
Pedicab service
| Answer
|
Total
|
University Co-ops
|
Non-University Co-ops
|
Canada
|
US
|
| YES
|
2
|
0
|
2
|
0
|
2
|
| Used to
|
1
|
0
|
1
|
0
|
1
|
| Want / Trying / Going to
|
3
|
0
|
3
|
0
|
3
|
}
Bike share or library
| Answer
|
Total
|
University Co-ops
|
Non-University Co-ops
|
Canada
|
US
|
| YES
|
11
|
5
|
6
|
4
|
7
|
| Used to
|
1
|
1
|
0
|
0
|
1
|
| Want / Trying / Going to
|
7
|
4
|
3
|
3
|
4
|
}
Bike related book library
| Answer
|
Total
|
University Co-ops
|
Non-University Co-ops
|
Canada
|
US
|
| YES
|
16
|
5
|
11
|
7
|
9
|
| Used to
|
1
|
0
|
1
|
1
|
0
|
| Want / Trying / Going to
|
6
|
1
|
5
|
1
|
5
|
}
Earn-a-bike
| Answer
|
Total
|
University Co-ops
|
Non-University Co-ops
|
Canada
|
US
|
| YES
|
28
|
4
|
24
|
3
|
24
|
| Used to
|
2
|
1
|
1
|
0
|
2
|
| Want / Trying / Going to
|
5
|
2
|
3
|
2
|
3
|
}
Bike valet or other parking services
| Answer
|
Total
|
University Co-ops
|
Non-University Co-ops
|
Canada
|
US
|
| YES
|
11
|
2
|
9
|
3
|
8
|
| Used to
|
1
|
0
|
1
|
0
|
1
|
| Want / Trying / Going to
|
9
|
3
|
6
|
3
|
6
|
}
Bike related workshops
| Answer
|
Total
|
University Co-ops
|
Non-University Co-ops
|
Canada
|
US
|
| YES
|
43
|
11
|
32
|
14
|
28
|
| Want / Trying / Going to
|
3
|
0
|
3
|
0
|
3
|
}
Bike related educational courses
| Answer
|
Total
|
University Co-ops
|
Non-University Co-ops
|
Canada
|
US
|
| YES
|
34
|
6
|
28
|
9
|
25
|
| Used to
|
1
|
1
|
0
|
0
|
1
|
| Want / Trying / Going to
|
7
|
2
|
5
|
3
|
4
|
}
Group rides
| Answer
|
Total
|
University Co-ops
|
Non-University Co-ops
|
Canada
|
US
|
| YES
|
33
|
9
|
24
|
12
|
21
|
| Used to
|
2
|
1
|
1
|
1
|
1
|
| Want / Trying / Going to
|
6
|
2
|
4
|
0
|
5
|
}
Bicycle advocacy
| Answer
|
Total
|
University Co-ops
|
Non-University Co-ops
|
Canada
|
US
|
| YES
|
28
|
8
|
20
|
10
|
18
|
| Used to
|
1
|
0
|
1
|
0
|
1
|
| Want / Trying / Going to
|
3
|
1
|
2
|
0
|
3
|
}
Art or literature displays
| Answer
|
Total
|
University Co-ops
|
Non-University Co-ops
|
Canada
|
US
|
| YES
|
20
|
3
|
17
|
9
|
11
|
| Used to
|
1
|
1
|
0
|
1
|
0
|
| Want / Trying / Going to
|
9
|
4
|
5
|
2
|
7
|
}
Other social events
| Answer
|
Total
|
University Co-ops
|
Non-University Co-ops
|
Canada
|
US
|
| YES
|
35
|
9
|
26
|
11
|
24
|
| Used to
|
2
|
1
|
1
|
1
|
1
|
| Want / Trying / Going to
|
2
|
0
|
2
|
0
|
2
|
}
Other social activism
| Answer
|
Total
|
University Co-ops
|
Non-University Co-ops
|
Canada
|
US
|
| YES
|
10
|
4
|
6
|
3
|
7
|
| Used to
|
1
|
1
|
0
|
1
|
0
|
| Want / Trying / Going to
|
9
|
2
|
7
|
5
|
3
|
}
Why did you stop offering some of your services?
| Answer
|
Total
|
University Co-ops
|
Non-University Co-ops
|
Canada
|
US
|
| Loss of resources
|
2
|
2
|
0
|
1
|
1
|
| Not enough funding
|
2
|
0
|
2
|
0
|
2
|
| Loss of interest from organizers
|
4
|
0
|
4
|
1
|
3
|
| Loss of interest from users
|
1
|
1
|
0
|
0
|
1
|
| Other
|
1
|
1
|
0
|
0
|
1
|
}

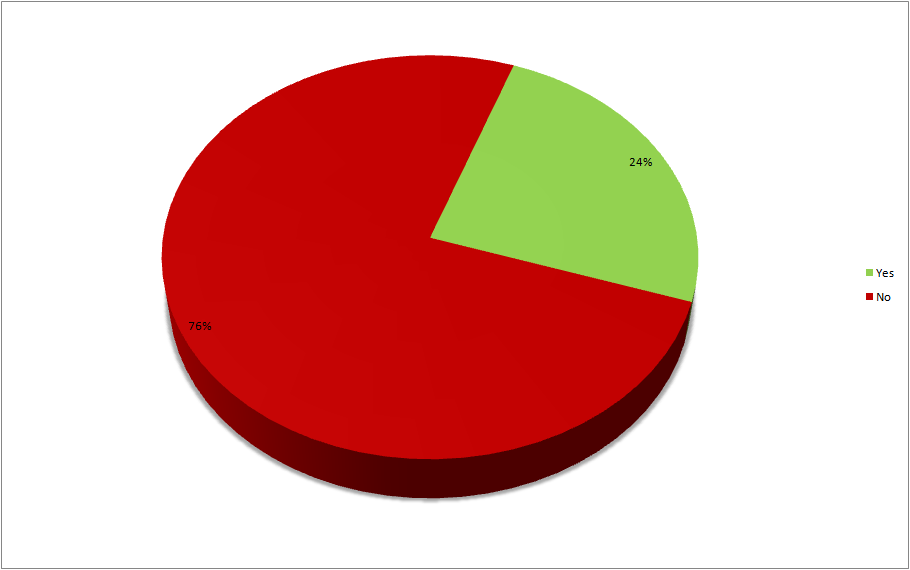
Is a membership required to use any of your services?
| Answer
|
Total
|
University Co-ops
|
Non-University Co-ops
|
Canada
|
US
|
| Yes
|
12
|
5
|
7
|
6
|
6
|
| No
|
37
|
8
|
29
|
9
|
27
|
}
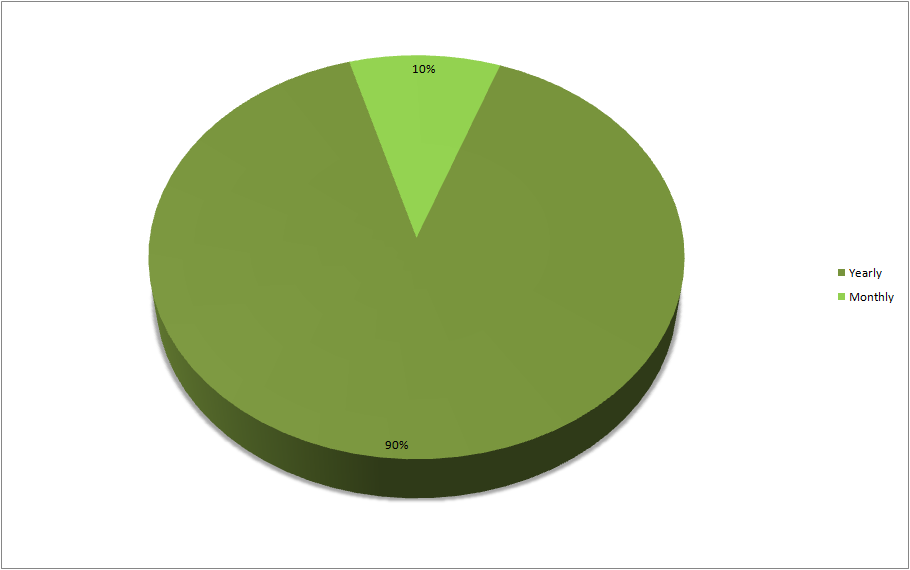
How often must a member pay for a membership in order to continue using any services?
| Answer
|
Total
|
University Co-ops
|
Non-University Co-ops
|
Canada
|
US
|
| Yearly
|
9
|
4
|
5
|
5
|
4
|
| Monthly
|
1
|
0
|
1
|
0
|
1
|
| Other
|
2
|
1
|
1
|
1
|
1
|
}
What is the cost of a membership?
| Calculation
|
Total
|
University Co-ops
|
Non-University Co-ops
|
Canada
|
US
|
| Count
|
9
|
4
|
5
|
5
|
4
|
| Sum
|
240
|
55
|
185
|
65
|
175
|
| Standard deviation
|
28.58
|
15.56
|
32.19
|
10.77
|
34.16
|
| Average
|
26.67
|
13.75
|
37
|
13
|
43.75
|
| 1st quartile
|
7.5
|
8.75
|
15
|
7.5
|
13.75
|
| 2nd quartile
|
10
|
7.5
|
20
|
5
|
32.5
|
| 3rd quartile
|
35
|
32.5
|
65
|
25
|
85
|
| Maximum
|
100
|
40
|
100
|
30
|
100
|
| Null values are ignored in calculations
|
| Q1 and Q3 calculated using minitab method
|
}
How many members joined in 2010?
| Calculation
|
Total
|
University Co-ops
|
Non-University Co-ops
|
Canada
|
US
|
| Count
|
10
|
4
|
6
|
5
|
5
|
| Sum
|
5641
|
2487
|
3154
|
4865
|
776
|
| Standard deviation
|
659.47
|
687.29
|
637.35
|
724.65
|
101.36
|
| Average
|
564.1
|
621.75
|
525.67
|
973
|
155.2
|
| Minimum
|
41
|
70
|
41
|
290
|
41
|
| 1st quartile
|
122.5
|
125.5
|
115.25
|
291
|
55.5
|
| 2nd quartile
|
291
|
308.5
|
245
|
292
|
70
|
| 3rd quartile
|
887.25
|
1431.25
|
912.25
|
1850
|
262.5
|
| Maximum
|
1900
|
1800
|
1900
|
1900
|
325
|
| Null values are ignored in calculations
|
| Q1 and Q3 calculated using minitab method
|
}

As of Dec 31st, 2010, how many members in total did you have?
| Calculation
|
Total
|
University Co-ops
|
Non-University Co-ops
|
Canada
|
US
|
| Count
|
10
|
4
|
6
|
5
|
5
|
| Sum
|
7798
|
2467
|
5331
|
6875
|
923
|
| Standard deviation
|
1114.66
|
691.35
|
1312.48
|
1327.56
|
118.36
|
| Average
|
779.8
|
616.75
|
888.5
|
1375
|
184.6
|
| Minimum
|
48
|
50
|
48
|
292
|
48
|
| 1st quartile
|
162.5
|
110.5
|
162
|
346
|
49
|
| 2nd quartile
|
312.5
|
308.5
|
350
|
400
|
50
|
| 3rd quartile
|
887.25
|
1431.25
|
1387.25
|
2800
|
312.5
|
| Maximum
|
3800
|
1800
|
3800
|
3800
|
325
|
| Null values are ignored in calculations
|
| Q1 and Q3 calculated using minitab method
|
}

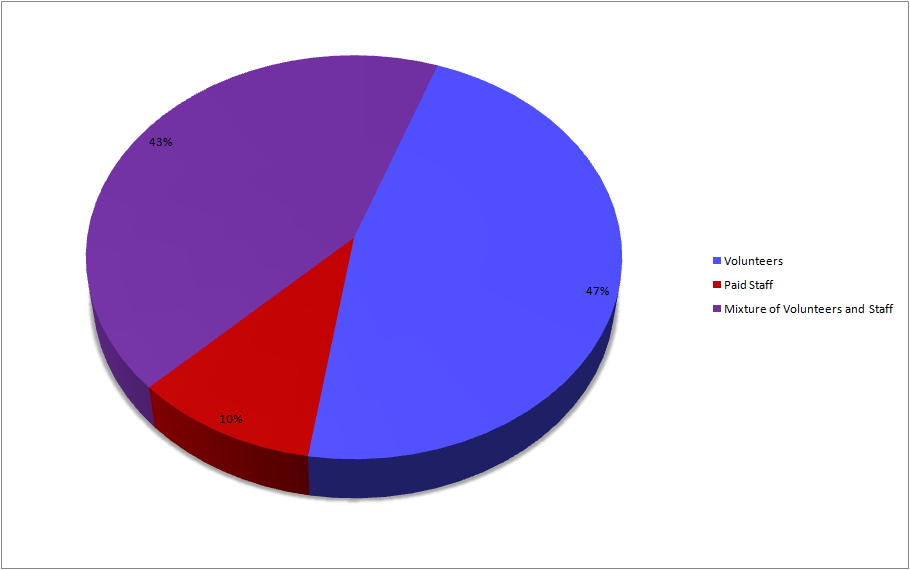
Who runs your organization?
| Answer
|
Total
|
University Co-ops
|
Non-University Co-ops
|
Canada
|
US
|
| Volunteers
|
23
|
4
|
19
|
6
|
16
|
| Paid Staff
|
5
|
1
|
4
|
0
|
5
|
| Mixture of Volunteers and Staff
|
21
|
8
|
13
|
9
|
12
|
}
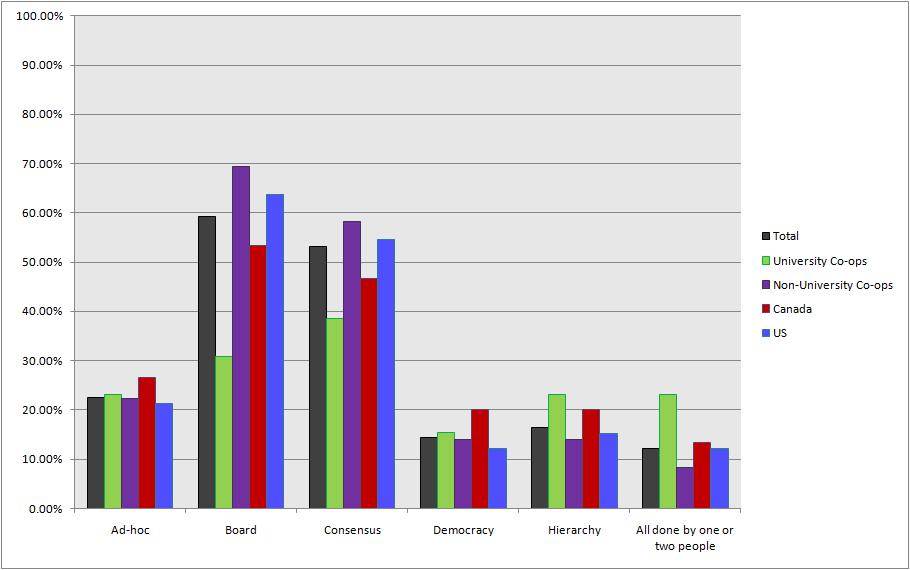
How does your organization run?
| Answer
|
Total
|
University Co-ops
|
Non-University Co-ops
|
Canada
|
US
|
| Ad-hoc
|
11
|
3
|
8
|
4
|
7
|
| Board
|
29
|
4
|
25
|
8
|
21
|
| Consensus
|
26
|
5
|
21
|
7
|
18
|
| Democracy
|
7
|
2
|
5
|
3
|
4
|
| Hierarchy
|
8
|
3
|
5
|
3
|
5
|
| All done by one or two people
|
6
|
3
|
3
|
2
|
4
|
| Other
|
6
|
2
|
4
|
2
|
4
|
}
SHOP
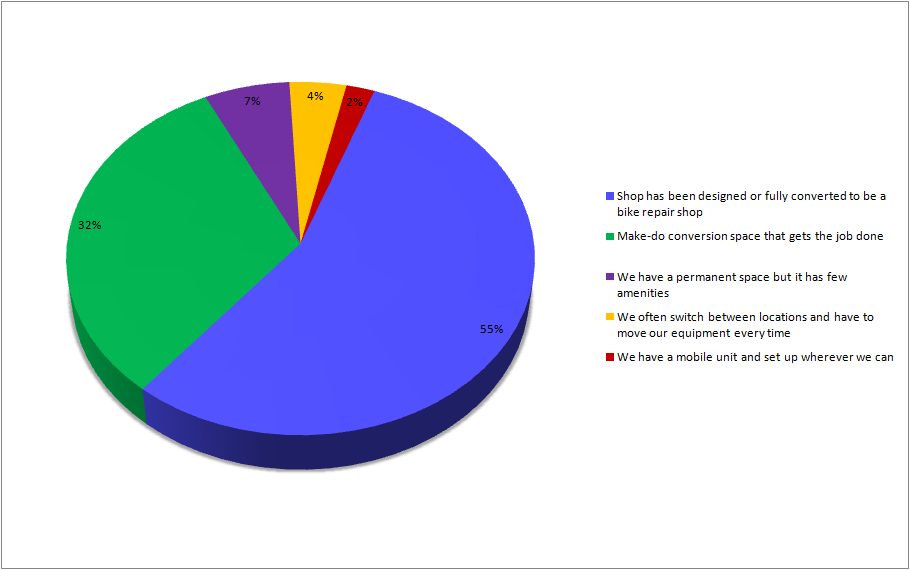
Which of the following best describes your shop space?
| Answer
|
Total
|
University Co-ops
|
Non-University Co-ops
|
Canada
|
US
|
| Shop has been designed or fully converted to be a bike repair shop
|
26
|
5
|
21
|
11
|
15
|
| Make-do conversion space that gets the job done
|
15
|
5
|
10
|
3
|
11
|
| We have a permanent space but it has few amenities
|
3
|
1
|
2
|
1
|
2
|
| We often switch between locations and have to move our equipment every time
|
2
|
1
|
1
|
0
|
2
|
| We have a mobile unit and set up wherever we can
|
1
|
1
|
0
|
0
|
1
|
| Other
|
1
|
0
|
1
|
0
|
1
|
}
Check all that apply to your shop space
| Answer
|
Total
|
University Co-ops
|
Non-University Co-ops
|
Canada
|
US
|
| We own our space
|
5
|
5
|
0
|
4
|
1
|
| 10.20%
|
38.46%
|
0.00%
|
26.67%
|
3.03%
|
| We must setup and tear-down all/most of our equipment every time we open
|
2
|
2
|
0
|
0
|
2
|
| 4.08%
|
15.38%
|
0.00%
|
0.00%
|
6.06%
|
| We share our space
|
4
|
4
|
0
|
1
|
3
|
| 8.16%
|
30.77%
|
0.00%
|
6.67%
|
9.09%
|
}
File:CENSUS2010 SHOP DESCRIPTION2.png
What kind of relationship do you have with those that you share the space with?
| Answer
|
Total
|
University Co-ops
|
Non-University Co-ops
|
Canada
|
US
|
| Sharing our space is the ideal situation for us
|
1
|
1
|
0
|
0
|
1
|
| Sharing our space causes no major problems, but we would like to have our own
|
3
|
3
|
0
|
1
|
2
|
}
File:CENSUS2010 SHOP SHARE.png
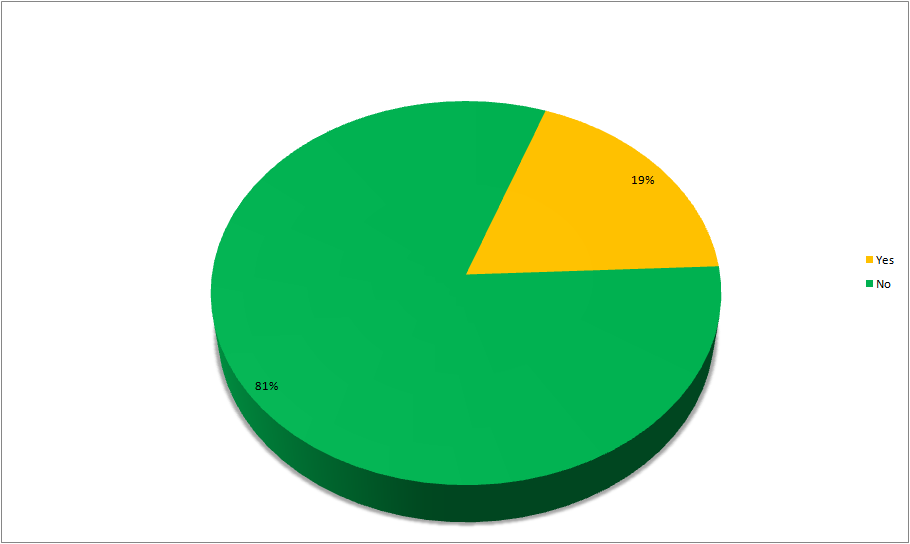
Would you say that you are lacking necessary equipment that is currently not feasible to obtain?
| Answer
|
Total
|
University Co-ops
|
Non-University Co-ops
|
Canada
|
US
|
| Yes
|
9
|
2
|
7
|
1
|
8
|
| No
|
39
|
11
|
28
|
14
|
24
|
}
Please explain
| Answer
|
8
|
2
|
6
|
1
|
7
|
}
File:CENSUS2010 SHOP LACKINGEXTRA.png
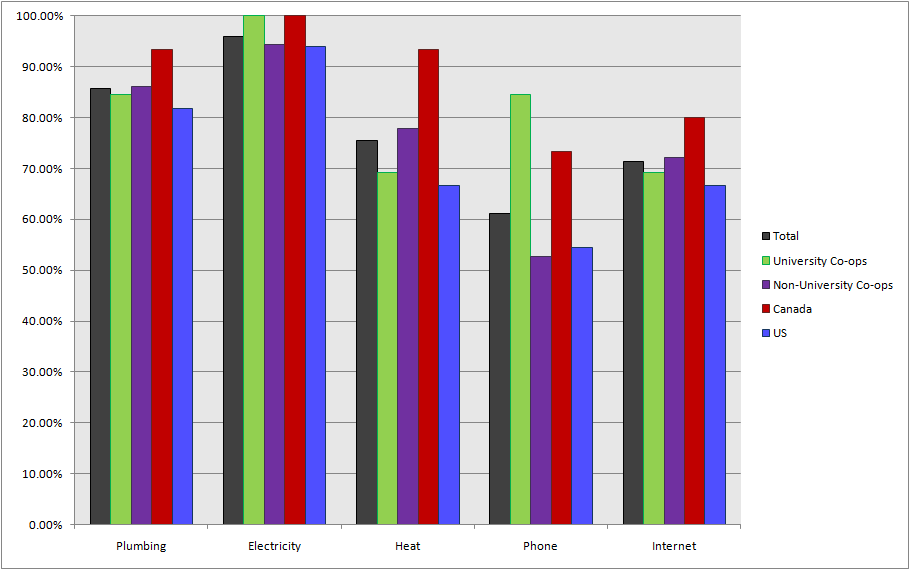
What utilities do you have on hand?
| Answer
|
Total
|
University Co-ops
|
Non-University Co-ops
|
Canada
|
US
|
| Plumbing
|
42
|
11
|
31
|
14
|
27
|
| Electricity
|
47
|
13
|
34
|
15
|
31
|
| Heat
|
37
|
9
|
28
|
14
|
22
|
| Phone
|
30
|
11
|
19
|
11
|
18
|
| Internet
|
35
|
9
|
26
|
12
|
22
|
| Other
|
8
|
3
|
5
|
3
|
5
|
| shower, kittens, AC
|
| Plumbing
|
85.71%
|
84.62%
|
86.11%
|
93.33%
|
81.82%
|
| Electricity
|
95.92%
|
100.00%
|
94.44%
|
100.00%
|
93.94%
|
| Heat
|
75.51%
|
69.23%
|
77.78%
|
93.33%
|
66.67%
|
| Phone
|
61.22%
|
84.62%
|
52.78%
|
73.33%
|
54.55%
|
| Internet
|
71.43%
|
69.23%
|
72.22%
|
80.00%
|
66.67%
|
}
CAPACITY
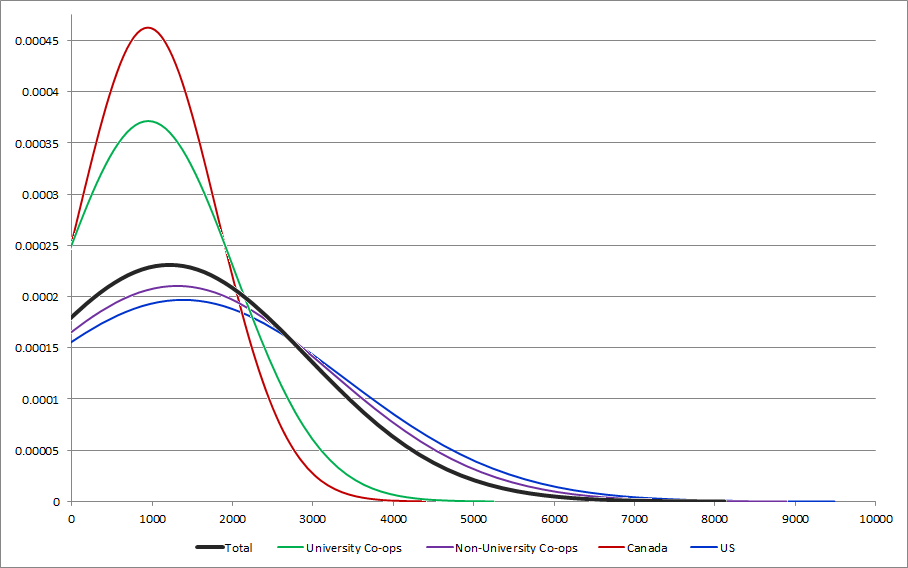
How many individuals used your shop services in 2010?
| Calculation
|
Total
|
University Co-ops
|
Non-University Co-ops
|
Canada
|
US
|
| Count
|
46
|
12
|
34
|
15
|
30
|
| Sum
|
55937
|
11415
|
44522
|
14195
|
41462
|
| Standard deviation
|
1726.57
|
1073.85
|
1895.45
|
862.23
|
2026.35
|
| Average
|
1216.02
|
951.25
|
1309.47
|
946.33
|
1382.07
|
| Minimum
|
30
|
70
|
30
|
30
|
40
|
| 1st quartile
|
272.5
|
225
|
272.5
|
400
|
250
|
| 2nd quartile
|
500
|
500
|
500
|
500
|
500
|
| 3rd quartile
|
2000
|
1000
|
2000
|
2000
|
2000
|
| Maximum
|
10000
|
3500
|
10000
|
3000
|
10000
|
| Null values are ignored in calculations
|
| Q1 and Q3 calculated using minitab method
|
}
How many users can your space support at one time?
| Answer
|
Total
|
University Co-ops
|
Non-University Co-ops
|
Canada
|
US
|
| 0
|
| 1
|
| 2
|
1
|
1
|
1
|
| 3
|
| 4
|
4
|
2
|
2
|
4
|
| 5
|
6
|
2
|
4
|
2
|
3
|
| 6
|
11
|
4
|
7
|
4
|
7
|
| 7
|
3
|
1
|
2
|
3
|
| 8
|
8
|
1
|
7
|
3
|
5
|
| 9
|
1
|
1
|
1
|
| 10
|
6
|
1
|
5
|
1
|
5
|
| 11
|
| 12
|
3
|
3
|
1
|
2
|
| 13
|
| 14
|
1
|
1
|
1
|
| 15
|
1
|
1
|
1
|
| 16
|
| Other
|
2
|
2
|
2
|
}

How many volunteers do you normally have in the shop at any given time?
| Answer
|
Total
|
University Co-ops
|
Non-University Co-ops
|
Canada
|
US
|
| 0
|
1
|
0
|
1
|
0
|
1
|
| 1
|
5
|
2
|
3
|
1
|
4
|
| 2
|
13
|
5
|
8
|
7
|
6
|
| 3
|
15
|
3
|
12
|
3
|
11
|
| 4
|
6
|
1
|
5
|
1
|
5
|
| 5
|
4
|
1
|
3
|
3
|
1
|
| 6
|
2
|
0
|
2
|
0
|
2
|
| Other
|
1
|
0
|
1
|
0
|
1
|
}
AVAILABILITY
How many months of 2010 was your shop open?
| Answer
|
Total
|
University Co-ops
|
Non-University Co-ops
|
Canada
|
US
|
| 4
|
1
|
0
|
1
|
0
|
1
|
| 6
|
1
|
0
|
1
|
0
|
0
|
| 7
|
3
|
1
|
2
|
1
|
2
|
| 8
|
3
|
0
|
3
|
1
|
2
|
| 9
|
3
|
0
|
3
|
0
|
3
|
| 10
|
2
|
1
|
1
|
0
|
2
|
| 11
|
3
|
3
|
0
|
1
|
2
|
| 12
|
30
|
7
|
23
|
12
|
18
|
}
On average, how many hours a week was your shop open for use?
| Calculation
|
Total
|
University Co-ops
|
Non-University Co-ops
|
Canada
|
US
|
| Count
|
45
|
11
|
34
|
14
|
30
|
| Sum
|
756
|
217
|
539
|
320
|
428
|
| Standard deviation
|
14.27
|
9.58
|
15.36
|
11.92
|
14.59
|
| Average
|
16.8
|
19.73
|
15.85
|
22.86
|
14.27
|
| 1st quartile
|
5.75
|
10
|
4.25
|
12.75
|
2
|
| Median value
|
14
|
15
|
12.5
|
20.5
|
11.5
|
| 3rd quartile
|
24.5
|
30
|
21
|
30
|
21
|
| Maximum
|
55
|
30
|
55
|
55
|
55
|
| Null values are ignored in calculations
|
| Q1 and Q3 calculated using minitab method
|
}
[[File:CENSUS2010_AVAILABILITY_HOURS [Winter].png]]
On average, how many hours a week was your shop open for use?
| Calculation
|
Total
|
University Co-ops
|
Non-University Co-ops
|
Canada
|
US
|
| Count
|
45
|
11
|
34
|
14
|
30
|
| Sum
|
952.5
|
247
|
705.5
|
357
|
595.5
|
| Standard deviation
|
18.62
|
11.9
|
20.3
|
13.7
|
20.17
|
| Average
|
21.17
|
22.45
|
20.75
|
25.5
|
19.85
|
| 1st quartile
|
8
|
8
|
8
|
12
|
6.75
|
| Median value
|
15
|
24
|
14.5
|
28
|
14.5
|
| 3rd quartile
|
30
|
30
|
25
|
31.25
|
24
|
| Maximum
|
90
|
38
|
90
|
62
|
90
|
| Null values are ignored in calculations
|
| Q1 and Q3 calculated using minitab method
|
}
[[File:CENSUS2010_AVAILABILITY_HOURS [Summer].png]]
How many days a week is your shop open on average?
| Answer
|
Total
|
University Co-ops
|
Non-University Co-ops
|
Canada
|
US
|
| 2
|
4
|
1
|
3
|
0
|
4
|
| 3
|
6
|
0
|
6
|
0
|
5
|
| 4
|
9
|
2
|
7
|
3
|
6
|
| 5
|
8
|
1
|
7
|
2
|
6
|
| 6
|
13
|
6
|
7
|
7
|
6
|
| 7
|
3
|
1
|
2
|
1
|
2
|
| 8
|
2
|
0
|
2
|
1
|
1
|
}
Other than membership how much does it cost to use your shop?
| Calculation
|
Total
|
University Co-ops
|
Non-University Co-ops
|
Canada
|
US
|
| Count
|
45
|
11
|
34
|
14
|
30
|
| Sum
|
84
|
15
|
69
|
19
|
65
|
| Standard deviation
|
2.62
|
2.23
|
2.72
|
2.02
|
2.84
|
| Average
|
1.87
|
1.36
|
2.03
|
1.36
|
2.17
|
| 3rd quartile
|
5
|
5
|
5
|
2.75
|
5
|
| Maximum
|
10
|
5
|
10
|
5
|
10
|
| Null values are ignored in calculations
|
| Q1 and Q3 calculated using minitab method
|
}

This cost is per...
| Answer
|
Total
|
University Co-ops
|
Non-University Co-ops
|
Canada
|
US
|
| Hour
|
11
|
1
|
10
|
3
|
8
|
| Day
|
1
|
0
|
1
|
0
|
1
|
| Visit
|
4
|
1
|
3
|
2
|
2
|
| Other
|
1
|
1
|
0
|
0
|
1
|
| No Cost
|
28
|
9
|
19
|
9
|
18
|
}
File:CENSUS2010 AVAILABILITY COSTPER.png
SHARE
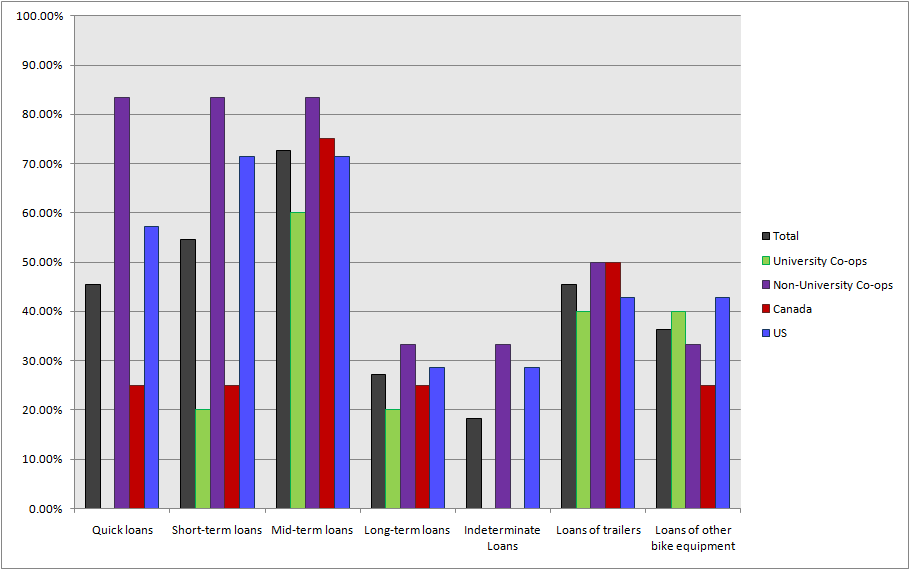
What types of bike sharing do you offer?
| Answer
|
Total
|
University Co-ops
|
Non-University Co-ops
|
Canada
|
US
|
| Quick loans
|
5
|
0
|
5
|
1
|
4
|
| Short-term loans
|
6
|
1
|
5
|
1
|
5
|
| Mid-term loans
|
8
|
3
|
5
|
3
|
5
|
| Long-term loans
|
3
|
1
|
2
|
1
|
2
|
| Indeterminate Loans
|
2
|
0
|
2
|
0
|
2
|
| Loans of trailers
|
5
|
2
|
3
|
2
|
3
|
| Loans of other bike equipment
|
4
|
2
|
2
|
1
|
3
|
| Other
|
2
|
1
|
1
|
0
|
2
|
}
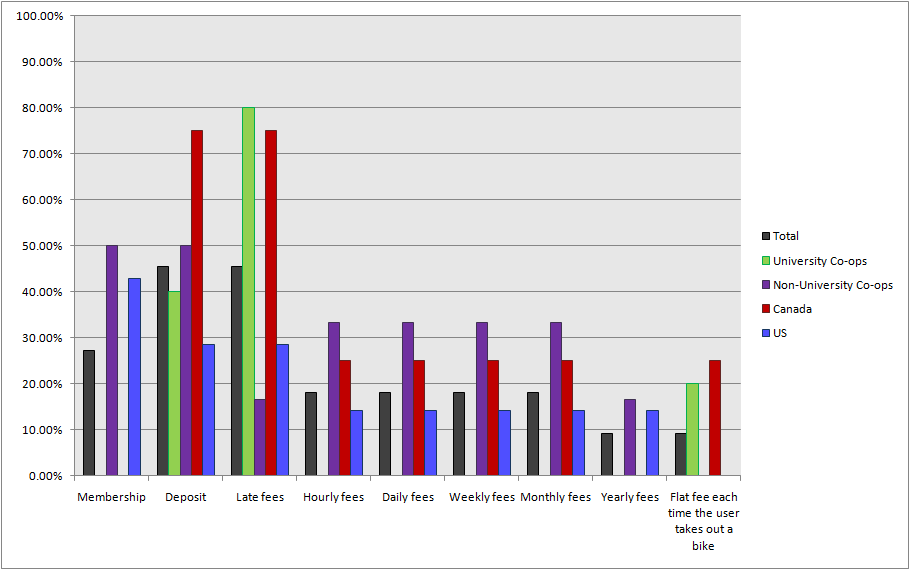
What costs to the user are associated with the system that you use?
| Answer
|
Total
|
University Co-ops
|
Non-University Co-ops
|
Canada
|
US
|
| Membership
|
3
|
0
|
3
|
0
|
3
|
| Deposit
|
5
|
2
|
3
|
3
|
2
|
| Late fees
|
5
|
4
|
1
|
3
|
2
|
| Hourly fees
|
2
|
0
|
2
|
1
|
1
|
| Daily fees
|
2
|
0
|
2
|
1
|
1
|
| Weekly fees
|
2
|
0
|
2
|
1
|
1
|
| Monthly fees
|
2
|
0
|
2
|
1
|
1
|
| Yearly fees
|
1
|
0
|
1
|
0
|
1
|
| Flat fee each time the user takes out a bike
|
1
|
1
|
0
|
1
|
0
|
}
What sorts of bikes do you have for lending?
| Answer
|
Total
|
University Co-ops
|
Non-University Co-ops
|
Canada
|
US
|
| New bikes subsidized or donated by a third party organization
|
1
|
0
|
1
|
0
|
1
|
| Used donations
|
10
|
4
|
6
|
4
|
6
|
| Other
|
2
|
1
|
1
|
1
|
1
|
}
File:CENSUS2010 SHARE BIKES.png
Did your retail donations or subsidies come with an advertising agreement?
| Answer
|
Total
|
University Co-ops
|
Non-University Co-ops
|
Canada
|
US
|
}
File:CENSUS2010 SHARE RETAILERS.png
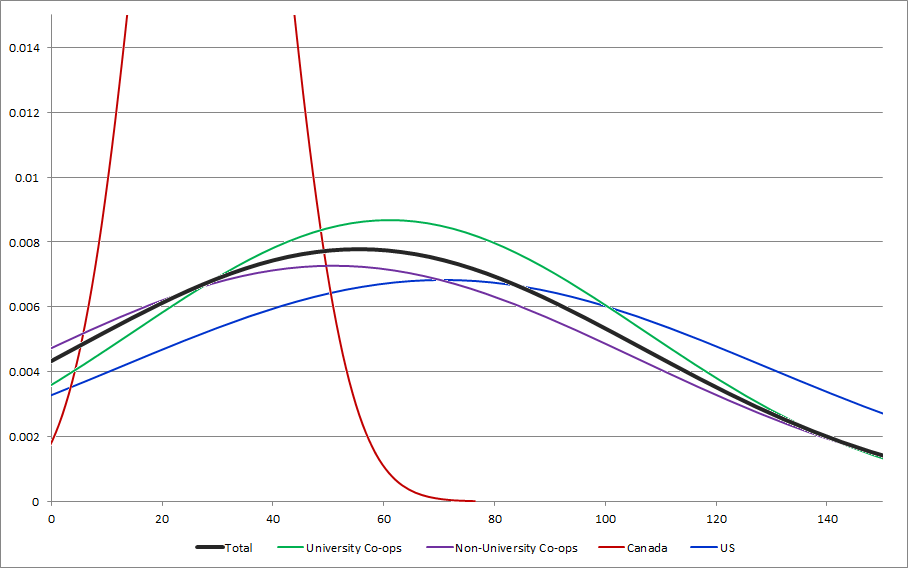
How many bikes are in your fleet?
| Calculation
|
Total
|
University Co-ops
|
Non-University Co-ops
|
Canada
|
US
|
| Count
|
11
|
5
|
6
|
4
|
7
|
| Sum
|
610
|
305
|
305
|
115
|
495
|
| Standard deviation
|
51.28
|
45.98
|
54.88
|
11.92
|
58.4
|
| Average
|
55.45
|
61
|
50.83
|
28.75
|
70.71
|
| 1st quartile
|
15
|
27.5
|
18.75
|
16.25
|
15
|
| Median value
|
25
|
35
|
20
|
27.5
|
25
|
| 3rd quartile
|
100
|
102.5
|
112.5
|
42.5
|
150
|
| Maximum
|
150
|
150
|
150
|
45
|
150
|
| Null values are ignored in calculations
|
| Q1 and Q3 calculated using minitab method
|
}
UNIVERSITY
Institution Name
| Answer
|
11
|
11
|
0
|
6
|
5
|
}
File:CENSUS2010 UNIVERSITY NAME.png
What is the approximate total number of students that attend the institution?
| Answer
|
Total
|
University Co-ops
|
Non-University Co-ops
|
Canada
|
US
|
| 500 - 1 000
|
1
|
1
|
0
|
0
|
1
|
| 10 000 - 25 000
|
2
|
2
|
0
|
2
|
0
|
| 25 000 - 50 000
|
8
|
8
|
0
|
4
|
4
|
}
File:CENSUS2010 UNIVERSITY SIZE.png
Approximately how many staff are employed at the university ?
| Calculation
|
Total
|
University Co-ops
|
Non-University Co-ops
|
Canada
|
US
|
| Count
|
6
|
6
|
3
|
3
|
| Sum
|
29507
|
29507
|
10107
|
19400
|
| Standard deviation
|
4165.11
|
4165.11
|
1209.54
|
5332.5
|
| Average
|
4917.83
|
4917.83
|
3369
|
6466.67
|
| Minimum
|
2107
|
2107
|
2107
|
2400
|
| 1st quartile
|
2326.75
|
2326.75
|
Non-University Co-ops
|
2107
|
2400
|
| 2nd quartile
|
3000
|
3000
|
0
|
2107
|
2400
|
| 3rd quartile
|
7250
|
7250
|
0
|
5000
|
14000
|
| Maximum
|
14000
|
14000
|
5000
|
14000
|
| Null values are ignored in calculations
|
| Q1 and Q3 calculated using minitab method
|
| Non-University Co-ops
|
}
File:CENSUS2010 UNIVERSITY SIZE2.png
How is your organization or collective officially associated with this institution? 0
| Answer
|
Total
|
University Co-ops
|
0
|
Canada
|
US
|
| part of the university itself
|
4
|
4
|
0
|
1
|
3
|
| part of the students' union
|
4
|
4
|
0
|
4
|
0
|
| 28
|
}
[[File:CENSUS2010_UNIVERSITY_ASSOC 0.png]]
Which would best describe your relationship with the institution?
| Answer
|
Total
|
University Co-ops
|
Canada
|
US
|
| Excellent, they have been consistently helpful
|
2
|
2
|
Non-University Co-ops
|
1
|
1
|
| Good, there have been few to no problems
|
5
|
5
|
0
|
3
|
2
|
| Unpredictable or arbitrary, depends on the individual department or staff member
|
2
|
2
|
0
|
1
|
1
|
| Problematic at best
|
1
|
1
|
0
|
0
|
1
|
| Not Recognized by the institution
|
1
|
1
|
28
|
1
|
0
|
}

Non-University Co-ops
| Answer
|
Total
|
University Co-ops
|
0
|
Canada
|
US
|
| They know about us but don't interfere
|
1
|
1
|
0
|
1
|
0
|
| 0
|
| 0
|
}
File:CENSUS2010 UNIVERSITY RELATION2.png
How does the institution support you? 0
| Answer
|
Total
|
University Co-ops
|
Canada
|
US
|
| Paid staff
|
4
|
4
|
1
|
3
|
| Subsidized rent
|
1
|
1
|
1
|
0
|
| Free rent
|
6
|
6
|
3
|
3
|
| Free utilities
|
7
|
7
|
0
|
4
|
3
|
| Advertising or regular positive recognition
|
3
|
3
|
0
|
3
|
0
|
| Free or subsidized room booking or equipment rentals
|
2
|
2
|
0
|
0
|
2
|
| Other
|
1
|
1
|
0
|
0
|
1
|
| 0
|
| 0
|
}
[[File:CENSUS2010_UNIVERSITY_SUPPORT 0.png]]
How does the students' union support your organization or collective? 0
| Answer
|
Total
|
University Co-ops
|
Canada
|
US
|
| Paid staff
|
1
|
1
|
1
|
0
|
| Free rent
|
2
|
2
|
2
|
0
|
| Free utilities
|
2
|
2
|
28
|
2
|
0
|
| Advertising or regular positive recognition
|
3
|
3
|
3
|
0
|
| Monetary contributions or grants
|
5
|
5
|
4
|
1
|
| Free or subsidized room booking or equipment rentals
|
4
|
4
|
4
|
0
|
| Other
|
1
|
1
|
1
|
0
|
| Non-University Co-ops
|
}
[[File:CENSUS2010_UNIVERSITY_SUSUPPORT 0.png]]
UNIMEMBERS
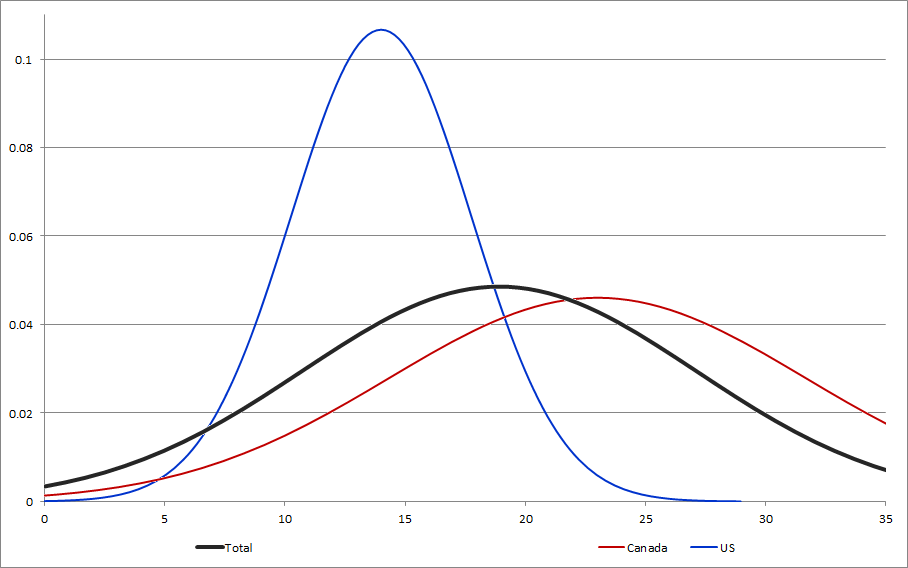
Approximately how many individual students did you serve in 2010?
| Calculation
|
Total
|
University Co-ops
|
Canada
|
US
|
| Count
|
11
|
11
|
6
|
5
|
| Sum
|
6385
|
6385
|
Non-University Co-ops
|
5045
|
1340
|
| Standard deviation
|
878.11
|
878.11
|
1114.71
|
162.16
|
| Average
|
580.45
|
580.45
|
840.83
|
268
|
| Minimum
|
75
|
75
|
75
|
90
|
| 1st quartile
|
100
|
100
|
168.75
|
95
|
| Median value
|
250
|
250
|
410
|
100
|
| 3rd quartile
|
500
|
500
|
Non-University Co-ops
|
1312.5
|
450
|
| Maximum
|
3300
|
3300
|
3300
|
500
|
| Null values are ignored in calculations
|
| Q1 and Q3 calculated using minitab method
|
}

Approximately how many faculty and staff members did you serve? 3
| Calculation
|
Total
|
University Co-ops
|
0
|
Canada
|
US
|
| Count
|
11
|
11
|
0
|
6
|
5
|
| Sum
|
565
|
565
|
3
|
395
|
170
|
| Standard deviation
|
51.31
|
51.31
|
24
|
63.54
|
19.85
|
| Average
|
51.36
|
51.36
|
65.83
|
34
|
| Minimum
|
5
|
5
|
10
|
5
|
| 1st quartile
|
15
|
15
|
17.5
|
10
|
| Median value
|
40
|
40
|
45
|
15
|
| 3rd quartile
|
50
|
50
|
Non-University Co-ops
|
106.25
|
50
|
| Maximum
|
200
|
200
|
3
|
200
|
50
|
| Null values are ignored in calculations
|
0
|
| Q1 and Q3 calculated using minitab method
|
0
|
| 3
|
| 24
|
}
[[File:CENSUS2010_UNIMEMBERS_STAFF Non-University Co-ops.png]]
How many individual students volunteered with your organization or collective?
| Calculation
|
Total
|
University Co-ops
|
Canada
|
US
|
| Count
|
11
|
11
|
6
|
5
|
| Sum
|
208
|
208
|
Non-University Co-ops
|
138
|
70
|
| Standard deviation
|
8.21
|
8.21
|
3
|
8.66
|
3.74
|
| Average
|
18.91
|
18.91
|
0
|
23
|
14
|
| Minimum
|
10
|
10
|
0
|
15
|
10
|
| 1st quartile
|
15
|
15
|
3
|
15
|
10
|
| Median value
|
15
|
15
|
24
|
19
|
10
|
| 3rd quartile
|
20
|
20
|
35
|
17.5
|
| Maximum
|
35
|
35
|
35
|
20
|
| Null values are ignored in calculations
|
| Q1 and Q3 calculated using minitab method
|
| Non-University Co-ops
|
| 3
|
}
How many faculty or staff members volunteered with your organization or collective? 0
| | | | | | | | | | | | | | | | | | | | | | | | | | | | | | | | | | | | | | | | | | | | | | | | | | | | | | | | | | | | |


